Look At Your Obama “All of the Above” Energy Policy
From The Pope To Paris
[Update: 12/24/15 – more recent data show US coal exports down 20%.]
If, as the Pope says, responding aggressively to the climate crisis is a moral imperative – which we believe it is – then so is telling the truth.
But with the Pope’s US visit imminent and the Paris Climate Conference negotiations upcoming in December, we’re bracing for a propaganda assault, not truth telling.
In that spirit, we thought we’d post a brief note with some relevant data and context within which to evaluate the invariable distortions of the Obama Administration’s climate “achievements”.
In fact, our skeptical selves have considered the distinct possibility that the Obama Alaska Charade was Obama’s strategic and very cynical attempt to get out in front of and pre-empt or inoculate himself from any criticism by the Pope on the climate front.
The Pope’s Encyclical On Care for Our Common Home demonstrated a basic – but qualitative – grasp of scientific literacy.
But has the Pope crunched the numbers and understood the implications of the “terrifying new math” and applied that quantitative perspective to the Obama climate record?
Much of the relevant data is readily available – with projections and accessible charts – from the US Energy Information Administration.
Will the Pope – and expected huge hordes of the faithful flock, with media stenographers in tow – ignore the math and give Obama a pass in the run-up to Paris?
Here’s some of the data the Pope’s people and the press corps should be looking at as they assess the Obama Clean Power Plan achievements.
These data do not consider significant greenhouse gas emissions attributable to the US imports from the shipping of commodities in global trade or the huge carbon footprint of the US military machine.
These data do not account for the future emissions from Obama administration’s coal leases, the arctic drilling, or off shore oil and gas leases, or EPA issued mountaintop mining permits or the huge projected expansion of the US fracking production and pipeline distribution promoted across the board and subsidized by Obama policy.
On the issue of coal alone, Greenpeace reports:
Of course, publicly owned coal also represents a major source of carbon pollution, as detailed in a 2012 report prepared for the Wilderness Society, “Greenhouse Gas Emissions from Fossil Energy Extracted from Federal Lands and Waters.” That report showed that in 2009, “fossil fuel extraction from federal lands and waters by private leaseholders could have accounted for approximately 23% of total U.S. GHG emissions and 27% of all energy-related GHG emissions.” The report also found that coal is responsible for most of the carbon pollution from those federally leased fossil fuels; in 2010, 888,946,650 metric tons of CO2, 57% of the total 1,550,638,866 metric tons of CO2.
These data do not consider the fact that the US has de-industrialized and off-shored manufacturing, such that the climate emissions from the products we import and consume are attributed to China, India and the other countries that have absorbed the former US manufacturing sector.
US emissions would be significantly higher if the emissions from manufacture of US imports we consume were included as US emissions.
Taken together, these current and projected greenhouse gas emissions that will result from Obama’s “all of the above” energy policy dwarf the emissions reductions of the Administration’s much touted Clean Power Plan.
That’s the kind of “netting” accounting analysis the Pope needs to consider. Do the math:
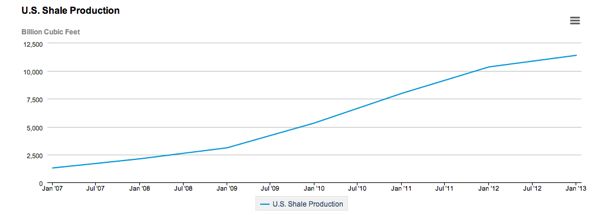
Shale Gas production has soared under Obama:
Contrary to the “bridge fuel” claims of the gas industry, an analysis shows that more than half of alleged US greenhouse gas emissions reductions attributable to fuel switching from coal to gas are erased by increases in coal exports, see: Has US Shale Gas Reduced CO2 Emissions?
The calculations presented in this report suggest that more than half of the emissions avoided in the US power sector may have been exported as coal. In total, this export is equivalent to 340 MtCO2 emissions elsewhere in the world, i.e. 52% of the 650 MtCO2 of potential emissions avoided within the US.
In addition to these substitution/export effects, also keep in mind that the alleged 50% GHG emissions reductions attributed to fuel switching from coal to “cleaner burning” natural gas fail to account for the lifecycle GHG emissions from gas production – from the fracking well to the power plant. Lifecycle emissions studies show that GHG warming potential from gas is as bad or could be worse than coal.
When the effects of fuel switching on coal exports and lifecycle gas emissions are considered, then emissions certainly have increased as a result of the explosion in gas production (which also diverts capital from investments in renewables and artificially low gas prices undermine the economics of renewables as del).
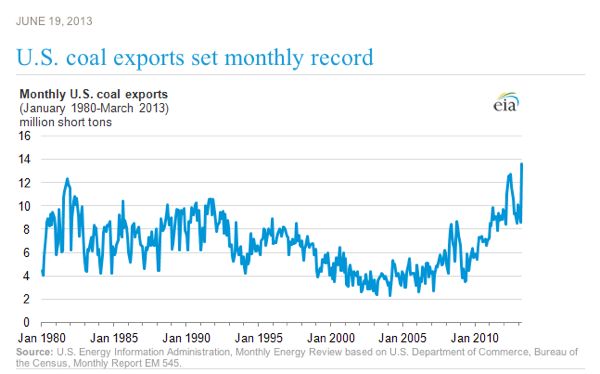
So let’s look at US coal production and export trends under Obama’s “All of the above” energy policy:
There is no “Obama War on Coal”
US coal production is stable, while exports have more than doubled under Obama:
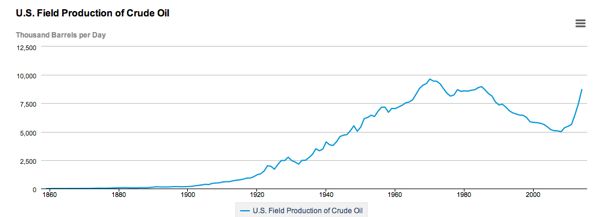
Of course, there’s also US oil production in the Obama fossil portfolio – that vertical rise on the right is Obama’s achievement: US oil production at record high levels, without counting new arctic, Gulf of Mexico, and offshore drilling
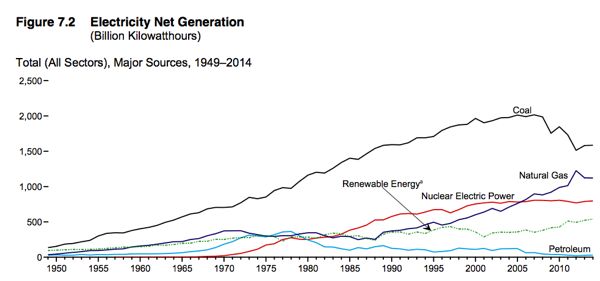
Now compare those steep rises in shale gas and oil production and coal exports with the very modest slight increase in the share of electric generation by renewable energy:
So, do the math – convert these fossil fuel production tables into greenhouse gas emissions. Here are EIA emissions factors – plug and chug.
We are confident that the math will show that Obama’s climate bark is far greater than his bite.


