Mr. Martin Managed a Mess of Meaningful Metrics.
A Mess of Meaningful Metrics Mr. Martin Managed.
If Mr. Martin Managed a Mess of Meaningful Metrics,
Then how Many Meaningful Metrics Must Mr. Martin Meet?

Bob Martin (source: NJDEP)
On Monday, Bob Martin, Governor Christie’s nominee for Commissioner of the Department of Environmental Protection (DEP), undergoes his confirmation hearing before the Senate Judiciary Committee.
Mr. Martin is a corporate consultant who has experience in privatization and deregulation. He advocates management metrics and holding employees accountable.
So we thought we would lay out some metrics for the Judiciary Committee to hold Mr. Martin accountable to (see also: Environmental Indicators Technical Report NJDEP).
Where we lack current or complete data below, we urge the Judiciary Committee to ask Mr. Martin what the facts are, to develop meaningful indicators, and to commit to numeric performance metrics. We urge the Committee to make Martin walk the walk:
1. Air Quality
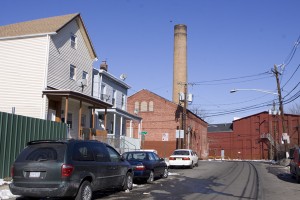 NJ fails to meet the federal Clean Air Act’s National Ambient Air Quality Standards (NAAQS). The entire state does not meet health based standards for air pollutants ozone, fine particulates, and numerous cancer causing toxic chemicals Here’s just one illustration by DEP of the huge public health impacts and economic costs of air pollution:
The health effects associated with exposure to fine particles are significant, mainly due to the fact that particles of this size can easily reach into the deepest regions of the lungs.
Significant health effects associated with fine particles exposure include:
- Premature mortality;
- Aggravation of respiratory and cardiovascular disease;
- Decreased lung function and difficulty breathing;
- Asthma attacks; and
- Serious cardiovascular problems, such as heart attacks and cardiac arrhythmia….
A particular concern for New Jersey with respect to PM2.5 is its ability to aggravate asthma. The NJDEP has estimated that approximately 1,900 deaths and 53,000 cases of asthma in the State each year are attributable to exceedances of the PM2.5 annual standard, with associated medical costs of approximately $15 billion. (link) …
According to the most recent Federal and State estimates, 765,125 New Jersey residents have asthma. In 2004, asthma sufferers in New Jersey accounted for 15,679 hospitalizations, which represents approximately one out of every 50 hospitalizations. Of these asthma hospitalizations, 5,175, or about one-third, were children. There were 1,838 deaths due to asthma between 1989 and 2003 in New Jersey. The risk of death from asthma increases considerably with age, with the over-65 population having the highest rates. (see: Asthma in New Jersey Annual Update 2006. New Jersey Department of Health and Senior Services, August 2006 (click on this for document)
 2. Water Quality
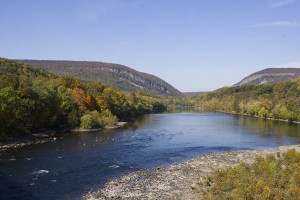
More than 65% of streams and rivers and 100% of lakes fail to meet water pollution standards and lack cleanup plans. Statewide Fish Consumption Advisories warn that fish and shellfish are too toxic to eat.
3. Safe Drinking Water
Over 12% of residential drinking water wells fail health based standards.
 4. Loss of Farmland, Forests, and Wetlands
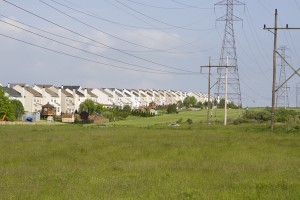
NJ continues to lose more than 15,000 acres of the last remaining forests, farms, and wetlands per year to new development.
5. Land Use and Land Cover – Over development
NJ is the nation’s most developed state, with the highest population density, impervious cover percentage, and cars and roads per square mile.
 6. Rising Green House Gas Emissions
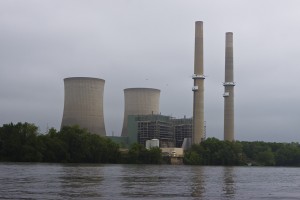
Despite the rhetoric, according to federal Department of Energy statistics, NJ’s greenhouse gas emissions continue to rise steeply.
7. Natural Resources are Capital Assets
Consider the economic benefit findings below which don’t include public health benefits of DEP pollution control and environmental quality programs and calculate the economic returns (ROI) on that small DEP investment!
Executive Summary
Our results are summarized below; all figures are 2004 dollars. The figures include only ecosystem services; they do not include ecosystem or abiotic goods or secondary economic activity related to a given ecosystem.
Wetlands provided the largest dollar value of ecosystem services: $9.4 billion/yr for freshwater wetlands and $1.2 billion/yr for saltwater wetlands. The most valuable services were disturbance regulation ($3.0 billion/yr), water filtration ($2.4 billion/yr), and water supply ($1.3 billion/yr) for freshwater wetlands, and waste treatment ($1.0 billion/yr) for saltwater wetlands. (Disturbance regulation means the buffering of floods, storm surges, and other events that threaten things valued by individuals or by society as a whole.)
Marine ecosystems provided the second-largest dollar amount of ecosystem services: $5.3 billion/yr for estuaries and tidal bays and about $389 million/yr for other coastal waters, including the coastal shelf out to the three-mile limit.

Fisheries (It should be noted that the fish and shellfish obtained from these ecosystems are covered elsewhere in this report and are not included in these totals.) Nutrient cycling (i.e., waste dilution and removal) was the most important service provided by marine ecosystems, with a value of $5.1 billion/yr.
Forests cover the largest area of any ecosystem type in New Jersey, and because of that the total value of the ecosystem services they provide is one of the highest at $2.2 billion/yr, excluding the value of timber. Habitat services are currently the most important of these services ($1.4 billion/yr); other important services provided by forests include water supply and pollination (about $238 million/yr each) and aesthetic and recreational amenities ($179 million/yr).
Urban green spaces and parks cover relatively little of New Jersey but has a relatively high dollar value per acre and provides an estimated $419 million of ecosystem services annually, principally aesthetic and recreational amenities ($361 million/yr). Ecoservice values for other types of urban land and for barren land were not investigated in this study.
Beaches (including dunes) provided by far the highest ecoservice value per acre; their small area limited their annual ecoservice value to about $330 million, mainly disturbance regulation ($214 million/yr) and aesthetic and recreational amenities ($116 million/yr).
Agricultural land includes both cropland (estimated at $78 million/yr of ecosystem services) and pastureland (estimated at $45 million/yr). These values relate solely to the services provided by farmland, mainly habitat services from cropland ($75 million/yr) and waste treatment services from pasture land ($26 million/yr). They do not include the value of the food provided by farms, which is covered elsewhere.
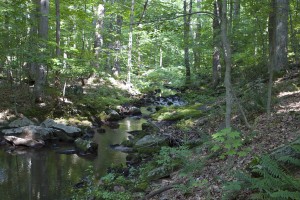
Open fresh water and riparian buffers provided services with an estimated annual value of $66 million and $51 million respectively, mainly water supply ($64 million/yr) and aesthetic and recreational amenities ($51 million/yr). Another part of this report covers the value of water as an ecosystem good.
The total value of these ecosystem services is $19.4 billion/year. If we exclude studies which were not peer-reviewed and/or which did not report on original research, the result is a lower estimate of $11.6 billion/year. However, this exclusion makes it impossible to estimate values for a number of ecosystems and/or ecoservices, and we believe that the higher figure better represents the value of the services provided by New Jersey’s  ecosystems. If the excluded studies are added back but weighted at 50%, the total value of ecosystem services would be $15.5 billion/year.
 8. Toxic Site Cleanup Metrics
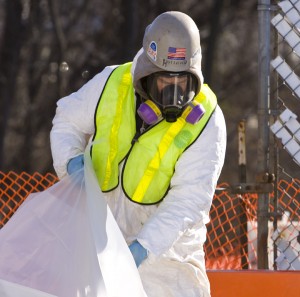
NJ has the most (114) federal Superfund sites and more than 20,000 other toxic sites.The NJ DEP’s state cleanup program has been privatized, and now “Licensed Site Professionals” (LSP) are in charge of certifying cleanup with little or no DEP oversight. Given the inherent potential for abuse, DEP must develop engineering performance metrics that look beyond paper certifications of cleanup by the LSP’s. One approach would be for DEP, based on more than 25 years of cleanup experience, to develop benchmarks and numeric metrics that state of the art cleanup technology can achieve for soil and groundwater. DEP must then promulgate these performance metrics as cleanup standards and require that LSP’s measure and report actual pounds of toxic chemicals actually removed at a cleanup site. DEP could then compare the LSP removal rates with state of the art performance metrics to monitor LSP certifications and enforce real cleanup requirements.
 9. Toxic Chemical Production
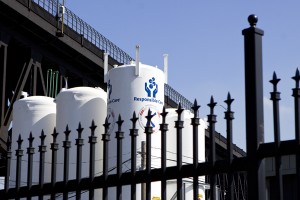
The problem is their toxic product. NJ industries use over 15 BILLION pounds of hazardous chemicals per year. That number has grown slightly from 1990 – 1998 (most recent data reported by DEP Pollution Prevention). That’s almost 2,000 pounds for each resident.
Hundreds of NJ Communities are threatened by scores of dangerous chemical facilities, where an accident or terror attack could kill more than 100,000 residents.

Residents are outraged by cancer cluster in Pompton Lakes from Dupont plant
10. Cancer rates
NJ has the nation’s highest cancer and asthma rates. Cancer clusters caused by industrial chemical emissions have been documented in Toms River and Pompton Lakes.
 11. Flood Damages
According to DEP:
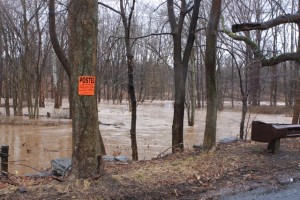
Each year, New Jersey sustains millions of dollars of flood damage, which is borne not only by those directly affected by flooding but also by taxpayers through relief measures and increased insurance premiums. Without Statewide regulations governing minimum construction standards in flood hazard areas, each individual county and municipality would have its own standards, or would have no standards whatsoever beyond the minimum requirements established by local building codes and the National Flood Insurance Program. By providing a stringent Statewide standard, the system of approval becomes more predictable for individuals designing and constructing within flood hazard areas and provides the highest level of protection for the public.
… the more stringent requirements of the proposed new rules may cause some development to relocate outside the flood hazard area altogether. This does not necessarily incur costs to the regulated community so much as it is likely to reduce the profit margin on potential development in flood hazard areas. Consequently, it is possible that the proposed new restrictions on development in flood hazard areas and riparian zones will reduce the value of existing property in these areas, but may also cause property values outside these areas to rise. (link to DEP Document)
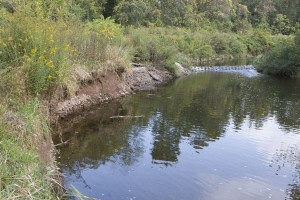 DEP also found that flooding and destruction of water resources are caused by over-development:
Nonpoint source pollution is dependent upon factors of topography, vegetative cover, population concentration, and land use. Buildings, roads, driveways, parking areas, lawns and even agricultural land uses add contaminants to stormwater and prevent or reduce the percolation of water into the soil, resulting in:
- Increased runoff of nonpoint source pollution and sedimentation of streams;
- Increased stormwater runoff and faster and higher flood peaks;
- Increased scour and erosion of streambanks;
- Reduced recharge to ground water and lower stream base flow; and
- Destruction of wildlife habitats.
The effects of development and increased impervious surfaces in watersheds combine to degrade the physical, chemical, and biological integrity of the State’s streams, rivers, lakes, wetlands, and estuaries. (link)
 12. Coastal Risks
NJ’s precious shore is highly over-developed and vulnerable to storms and sea level rise.
13. Soil Erosion and Soil Compaction
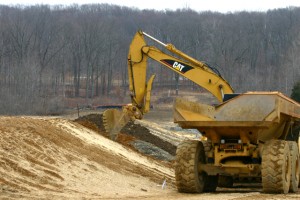
Builders trip, stockpile and compact soil.
Construction practices by NJ builders compact soil, making it behave more like pavement than soil. This increases flooding, pollutes streams, and depletes groundwater recharge which jeopardizes water supply and ecological integrity.
14. Industry Compliance rates
The data clearly illustrate two fundamental policy considerations: first, traditional mandatory frequent inspections and mandatory fines and penalties for violations of permits vastly improve both environmental compliance and performance rates (see: Clean Water Enforcement Act). Second, voluntary compliance is an oxymoron and abject failure (see EPA Inspector General Reports:
- Voluntary Greenhouse Gas Reduction Programs Have Limited Potential, 08-P-0206, July 23, 2008
- Voluntary Programs Could Benefit from Internal Policy Controls and a Systematic Management Approach, 2007-P-00041, September 25, 2007
- Ongoing Management Improvements and Further Evaluation Vital to EPA Stewardship and Voluntary Programs, Report No. 2005-P-00007, February 17, 2005
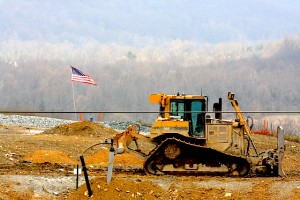
Warren County Landfill
15. Material Consumption and Solid Waste Generation rates
Solid waste disposal is strictly regulated in NJ. But life-cycle environmental impact analysis shows that by far the majority of impacts – as high as 90% – are the result of activities prior to disposal – from mining to manufacture to transportation and distribution. This suggests the need for a material management policy that stresses reductions in material use and gross over-consumption rates. But the Whitman DEP abandoned the life-cycle assessment approach and source reduction policies in 1994. Since then, material use, consumption rates, and garbage generation rates continue to rise, despite efforts to recycle (see: DEP State Solid Waste Management Plan).
 16. Low impact Food production for local in state consumption
NJ is not sufficient in food production and industrial farming practices are unsustainable in terms of high energy, water, chemicals and fertilizer use; soil erosion and loss of soil fertility; and lack of local in state markets for sustainably, locally, and organically grown produce. We need metrics to promote sustainable, healthy, and low impact local agriculture.
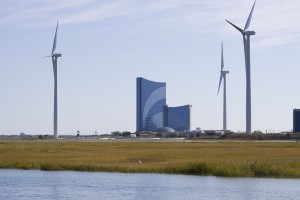
Atlantic City wind
17. Renewable Energy Production
Where did all that Clean Energy Fund money go?

Camden, NJ
18. Urban Environmental Quality and Environmental Justice
NJ’s racially and economical segregated urban communities bear unjust disproportionate pollution and health burdens.
19. Preventable environmentally related disease

Dr. Robert D. Bullard
Dr. Robert D. Bullard, of Clark Atlanta University, the man known as “the father of the US environmental justice movement” spoke recently at Drew University. Bullard pioneered mapping the relationships between race, income, and pollution. It only took NJ DEP 35 years to apply Dr. Bullard’s mapping methodology in NJ- see: DEP Discovers Discrimination – Dumps Environmental Justice Issue in Christie’s Lap (and 30 to engage the issue in Camden).
Dr. Bullard’s talk was titled Growing Smarter: achieving healthy and livable communities for all.
Bullard had great photographs and slides to illustrate his data on everything from the lack of access to fresh fruit and vegetables at local grocery stores (despite a preponderance of liquor stores), lack of green space, limited recreational opportunities, and unhealthy schools and homes located right next to industrial pollution sources like chemical factories and power plants.
Citing a closed hospital in a black neighborhood in Atlanta, he said the message it sent to the community was “shut up and die”.
Bullard seamlessly integrated basic health prevention (diet and exercise) with spatial analysis of land use, transportation, energy, health, educational and environmental polices.
Bullard’s overarching theme was “we must put health at the center of our policies” and that citizens and communities must organize to fight for sustainable, just, and healthy communities.
20. Strong Bi-Partisan Public Support for Environmental Protection
A recent Monmouth University/Gannett Poll found widespread public support for strong environmental regulations (See the press release and poll results and methodology by clicking here).
Seventy Nine (79%) of NJ residents said they would be upset in Governor Christie relaxed environmental regulations (42% very upset and 37% somewhat upset).
Support was highest among Democrats, where a surprising 91% supported strong environmental regulations, while 75% of Independents and even 67% of registered Republicans said they would be upset if NJ’s environmental regulations were relaxed in response to the state budget and economic crisis.
Just 15% were not too upset and a mere 4% actually supported rollbacks, saying they were not upset at all (link)
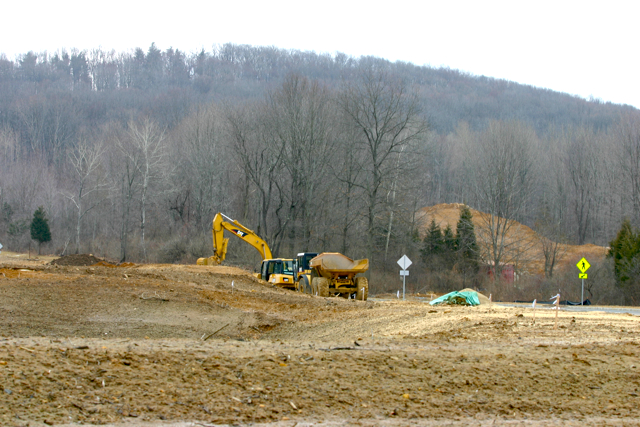
Developers are destroying Highlands forests while neglecting urban NJ


Pingback: WolfeNotes.com » Ten Questions the Senate SHould Ask Bob Martin
Pingback: WolfeNotes.com » Environmental Rollback Legislation Advances
Pingback: WolfeNotes.com » It Took Cap-and-Trade to Smoke Dem Opposition Out
Pingback: WolfeNotes.com » Christie’s Earth Week: Bend Over and Get “Balanced”
Pingback: WolfeNotes.com » DEP Commissioner Martin Called to Testify Tomorrow
Pingback: WolfeNotes.com » NJ Parallels to Gulf Disaster – Monday Oversight Hearing
Pingback: WolfeNotes.com » Clean Water Council Considering Privatization
Pingback: WolfeNotes.com » Year of Rollback, Retreat, and Appeasement – Christie Worse Than Whitman 1994
Pingback: WolfeNotes.com » Ocean Ecosystems, Fishermen, and Shore Economy Harmed by Craven Politics
Pingback: WolfeNotes.com » “We Don’t Keep Track of Specifics”
Pingback: WolfeNotes.com » DEP Fails Clean Water Metric – EPA Battle Brewing
Pingback: WolfeNotes.com » Taking a Closer Look at Christie DEP Changes
Pingback: WolfeNotes.com » Toxic Chemicals Released In South Jersey Train Accident Force Evacuation
Pingback: WolfeNotes.com » Toxic Train Wreck – The Product is the Problem
Pingback: Quantum Vision System Review
Pingback: garcinia cambogia extract pure where to buy